CHALLENGE
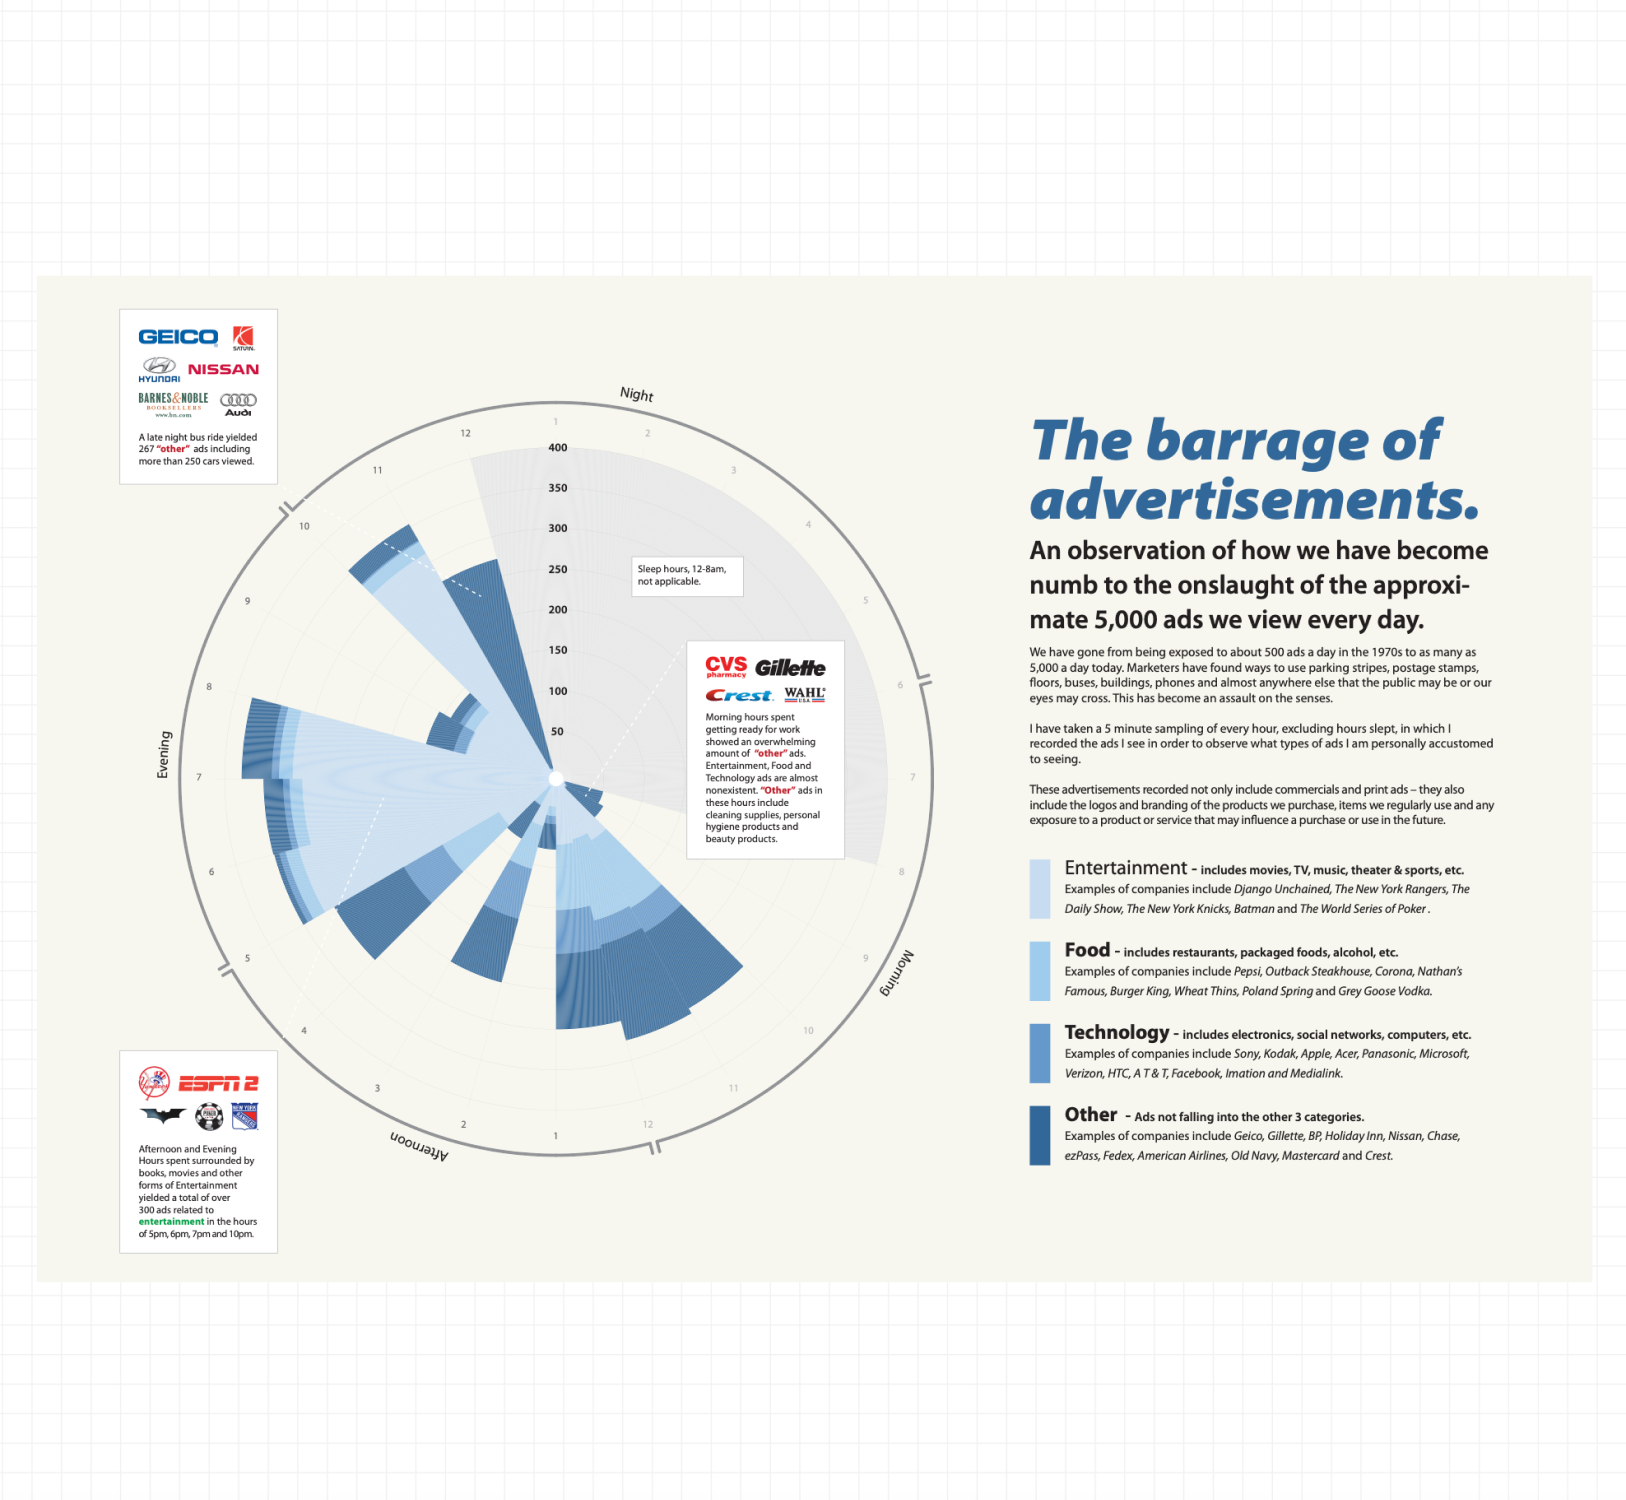
In a world saturated with marketing messages, consumers are exposed to an overwhelming number of advertisements every day—often without realizing it. The goal of this project was to explore how desensitized we’ve become to modern advertising through both data and personal observation. I wanted to transform abstract statistics into a relatable, visual story that would make people pause and reconsider the scale of the advertising landscape.
SOLUTION
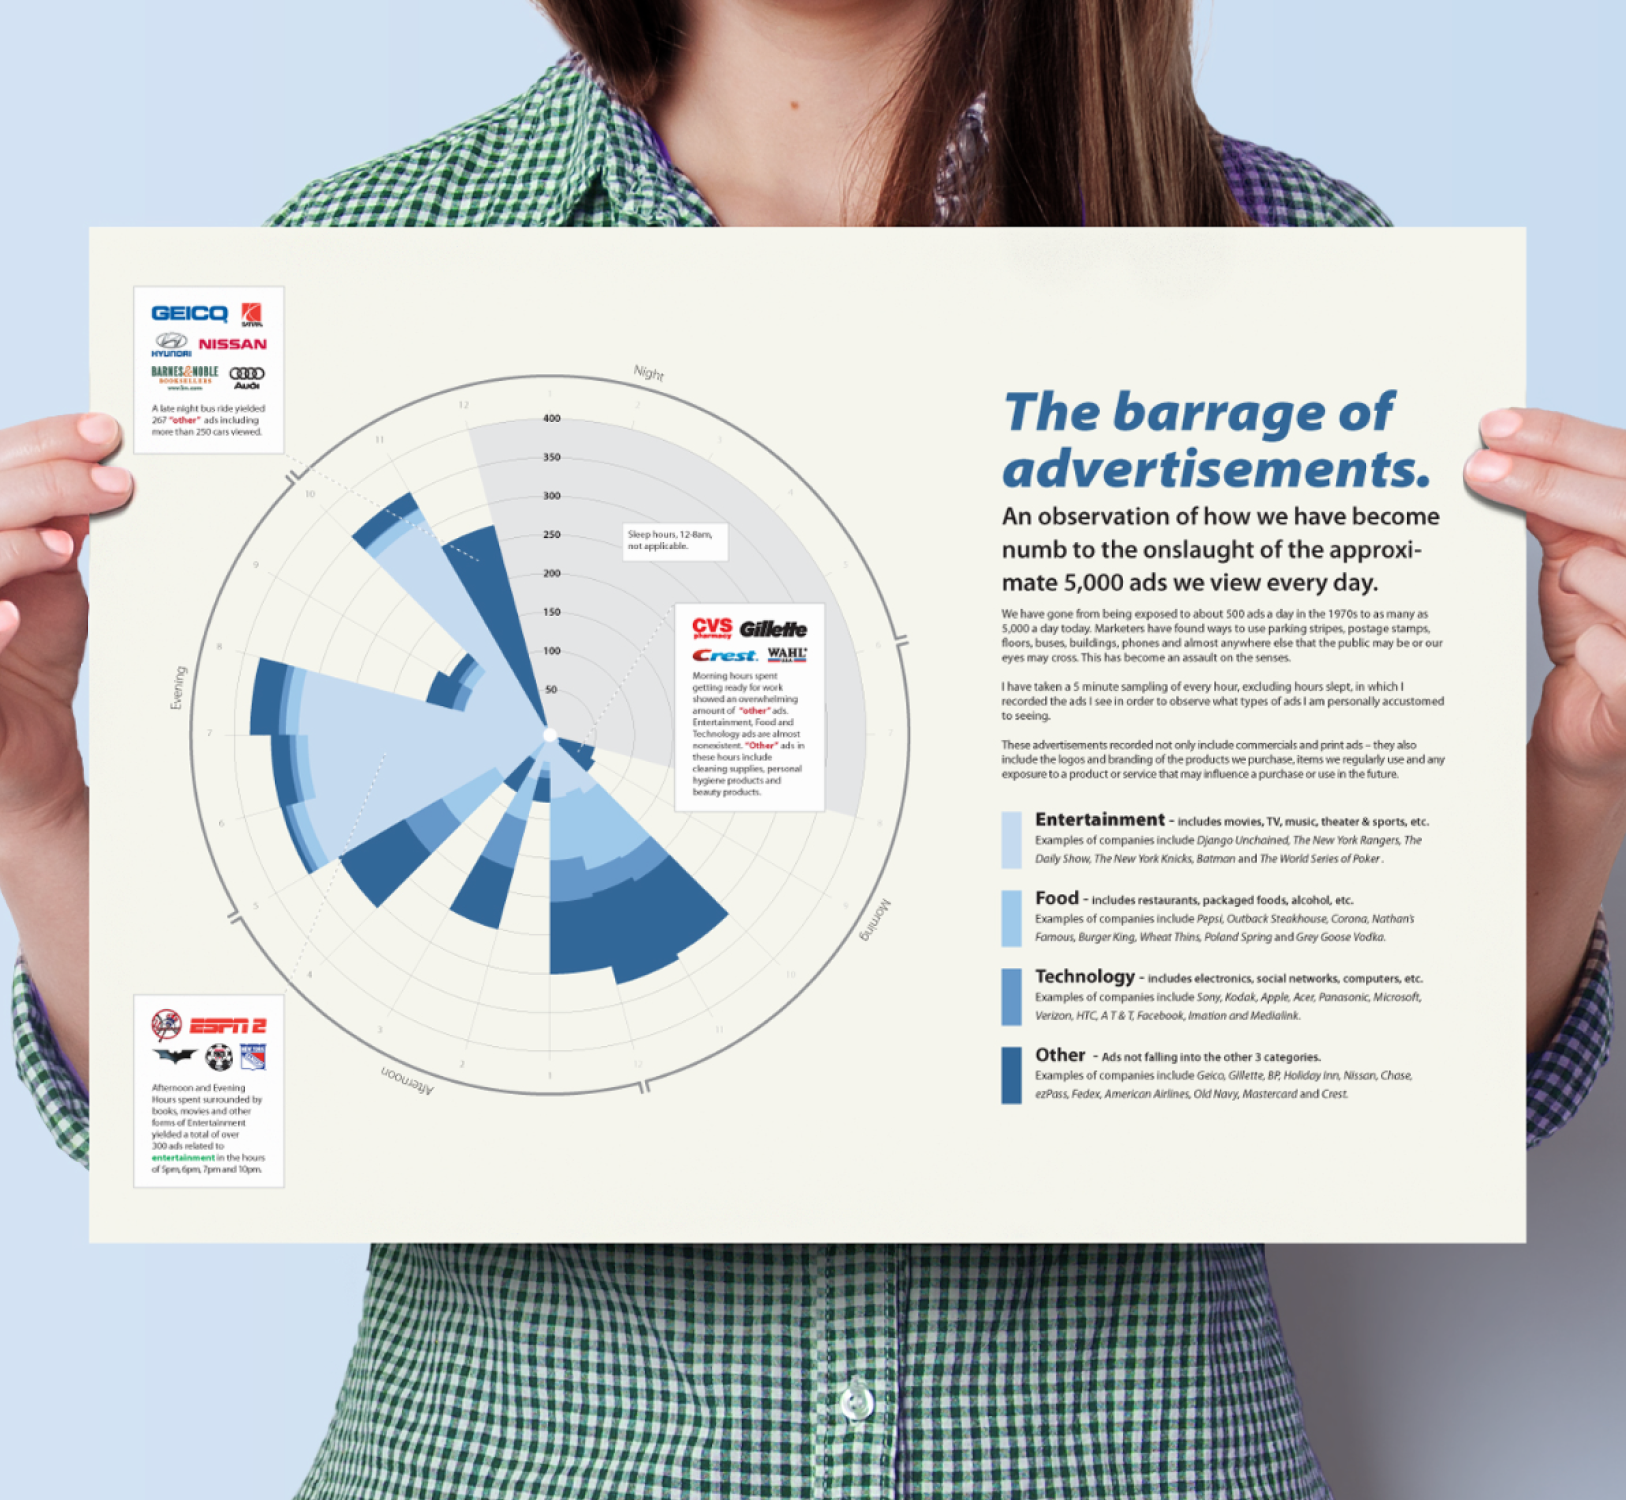
I researched, designed, and created an infographic that examines the staggering rise in daily ad exposure—from around 500 ads per day in the 1970s to over 5,000 today. Drawing on studies in marketing trends and consumer psychology, I combined data visualization with thoughtful design to present complex information in a clear and engaging way.
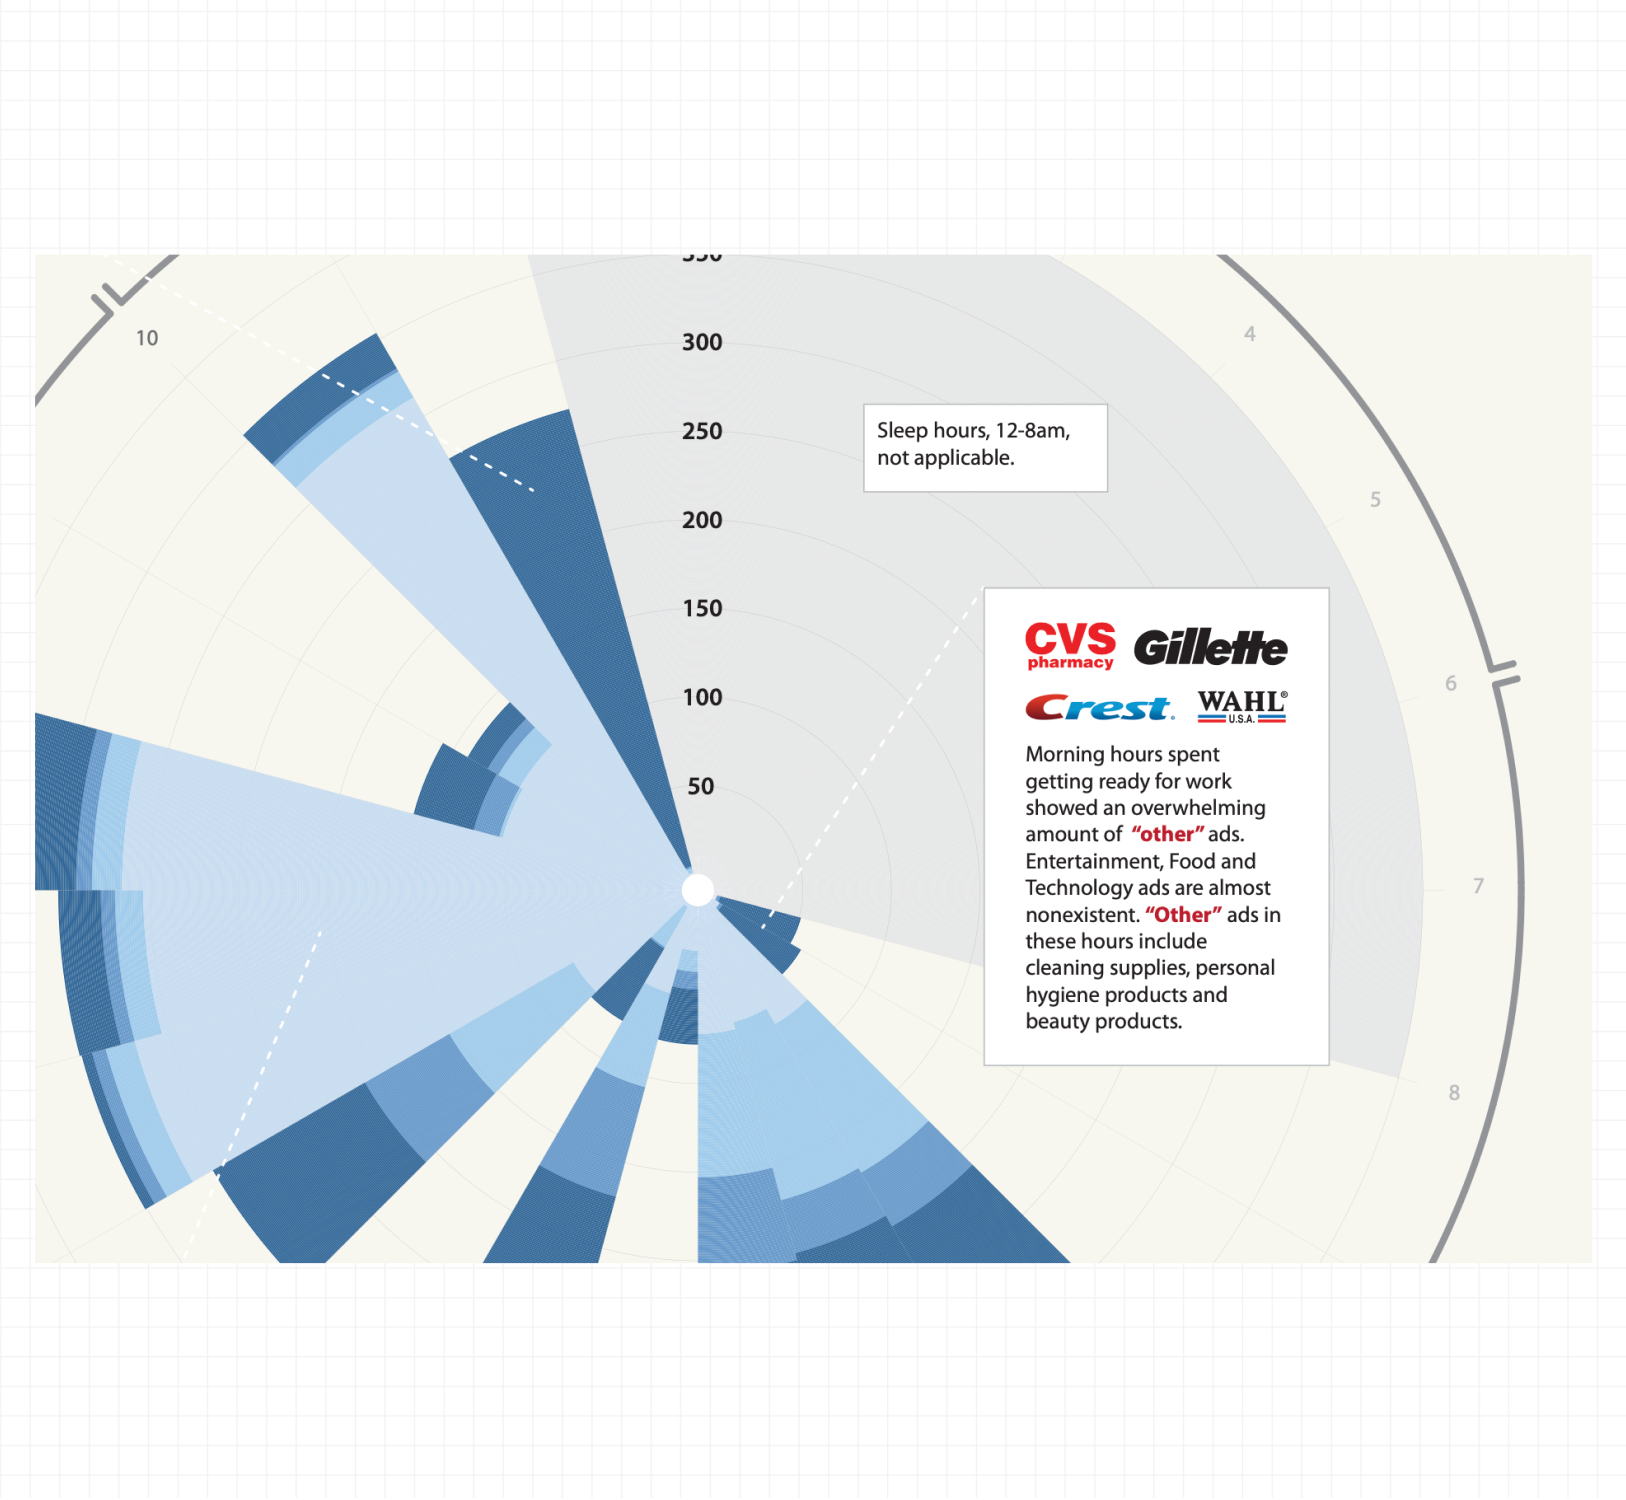
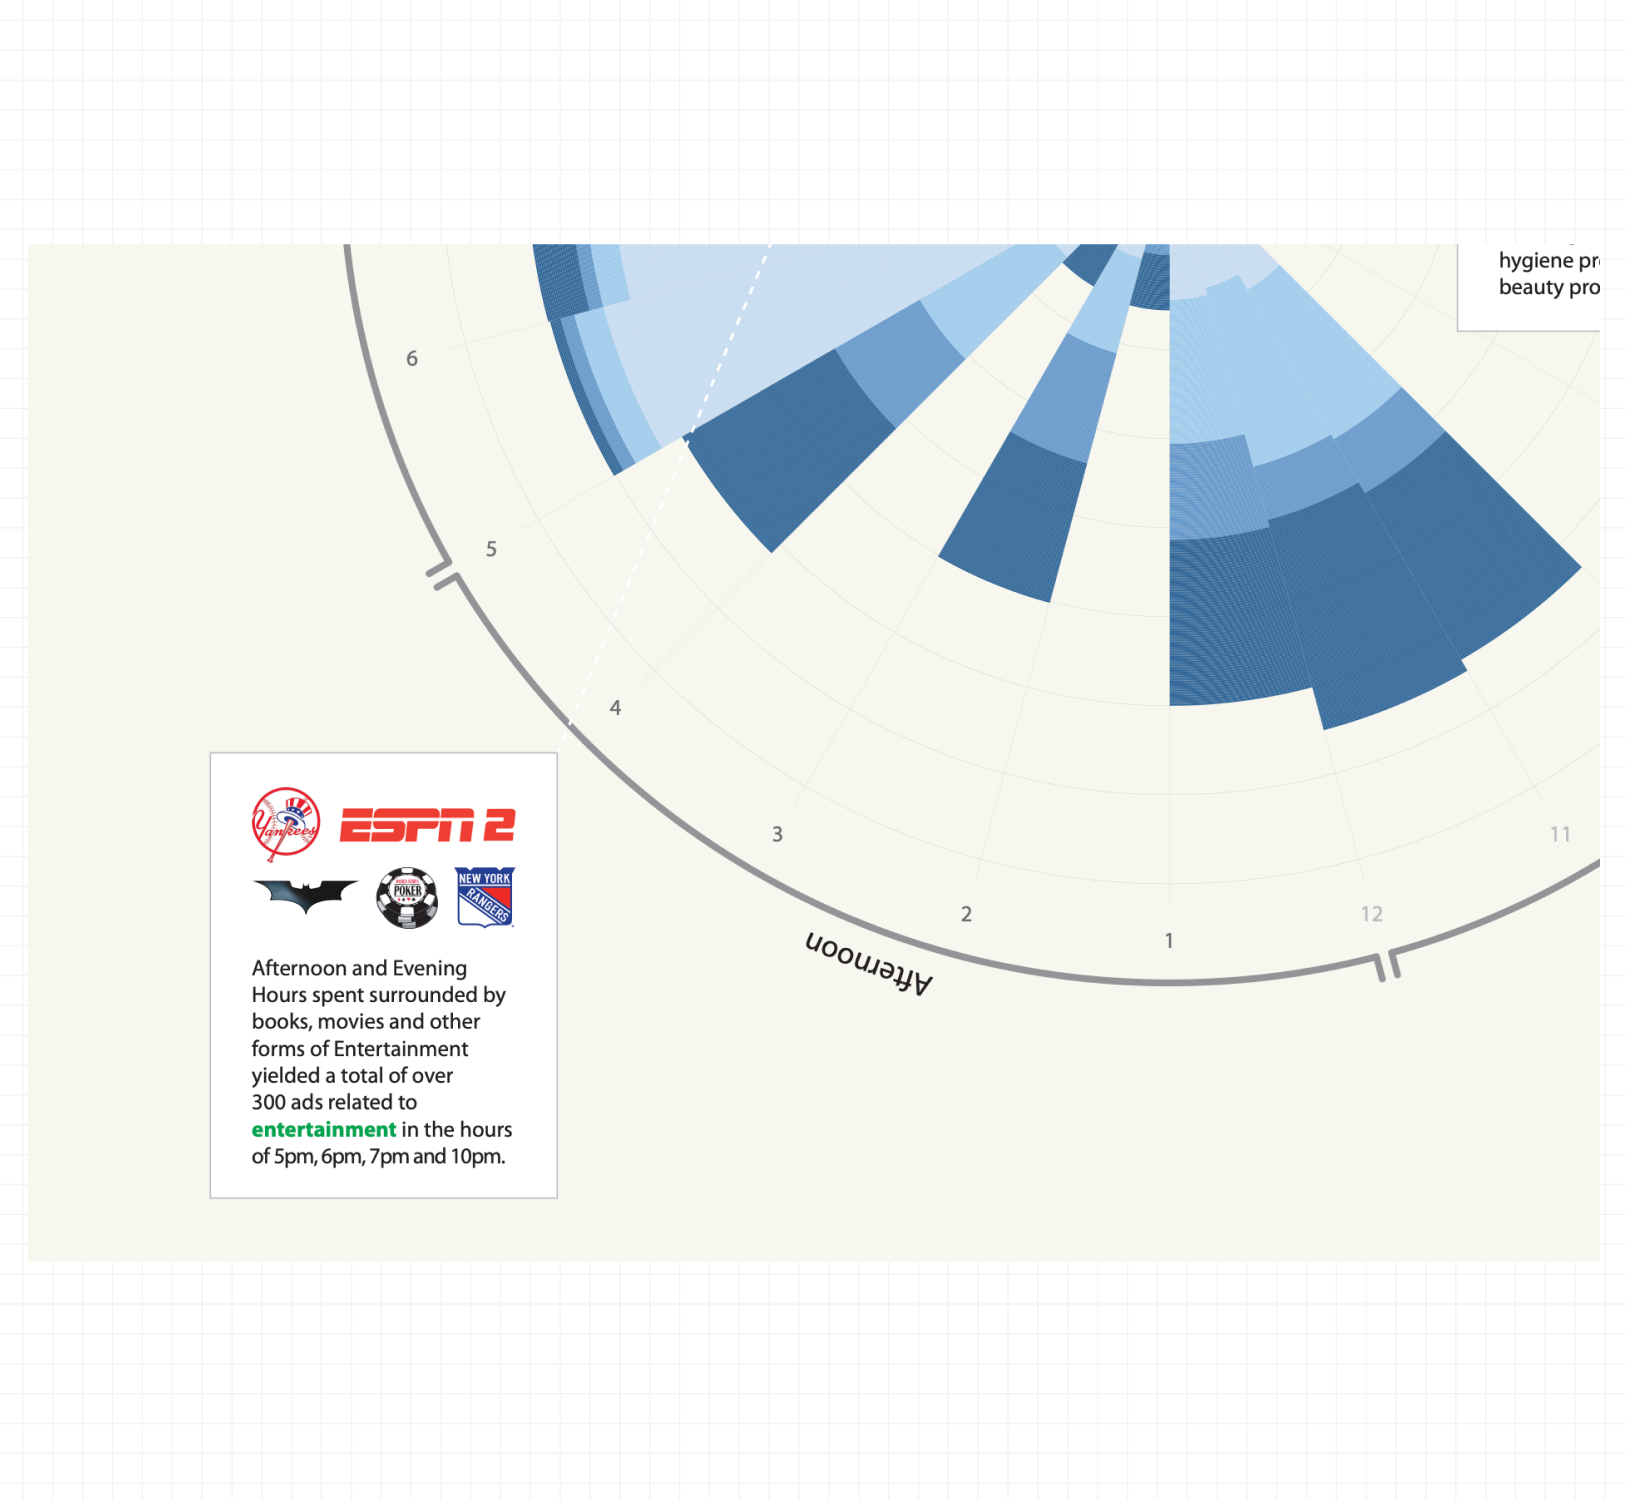
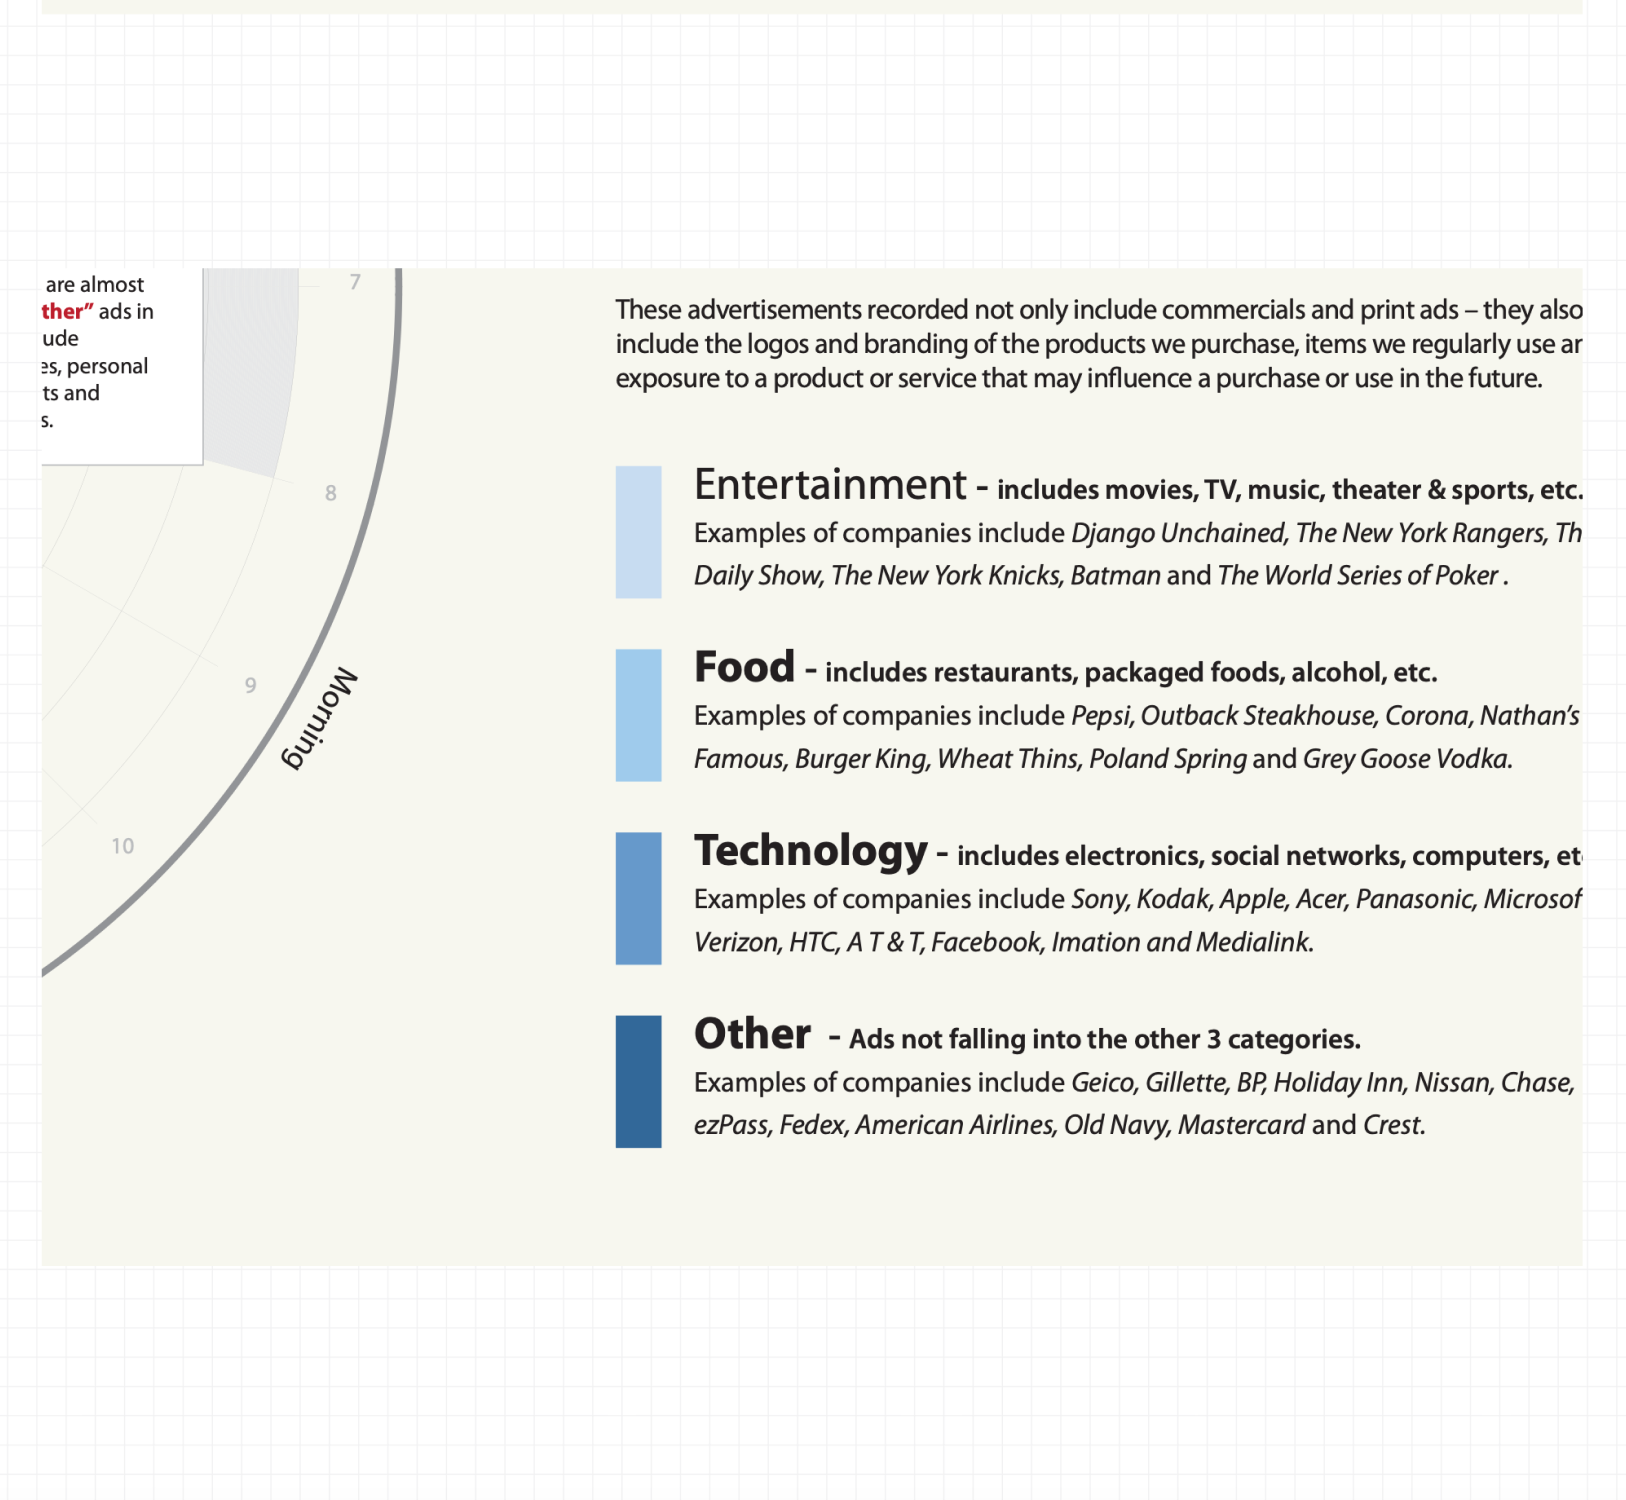
To ground the data in real experience, I conducted a personal study, tracking every advertisement I encountered during a five-minute window each hour (excluding sleep). This included not just traditional ads, but logos, product packaging, and subtle branding that can influence consumer behavior. The result is a visually compelling infographic that captures how pervasive advertising has become—and how easily it blends into our everyday lives.
TASKS
Research
Infographic Design
Data Visualization
TECHNICAL